
Spring fever gripped Greater Vancouver's real estate market in March, with sales up 53.7% and prices at record highs. Here's our infographic on the key stats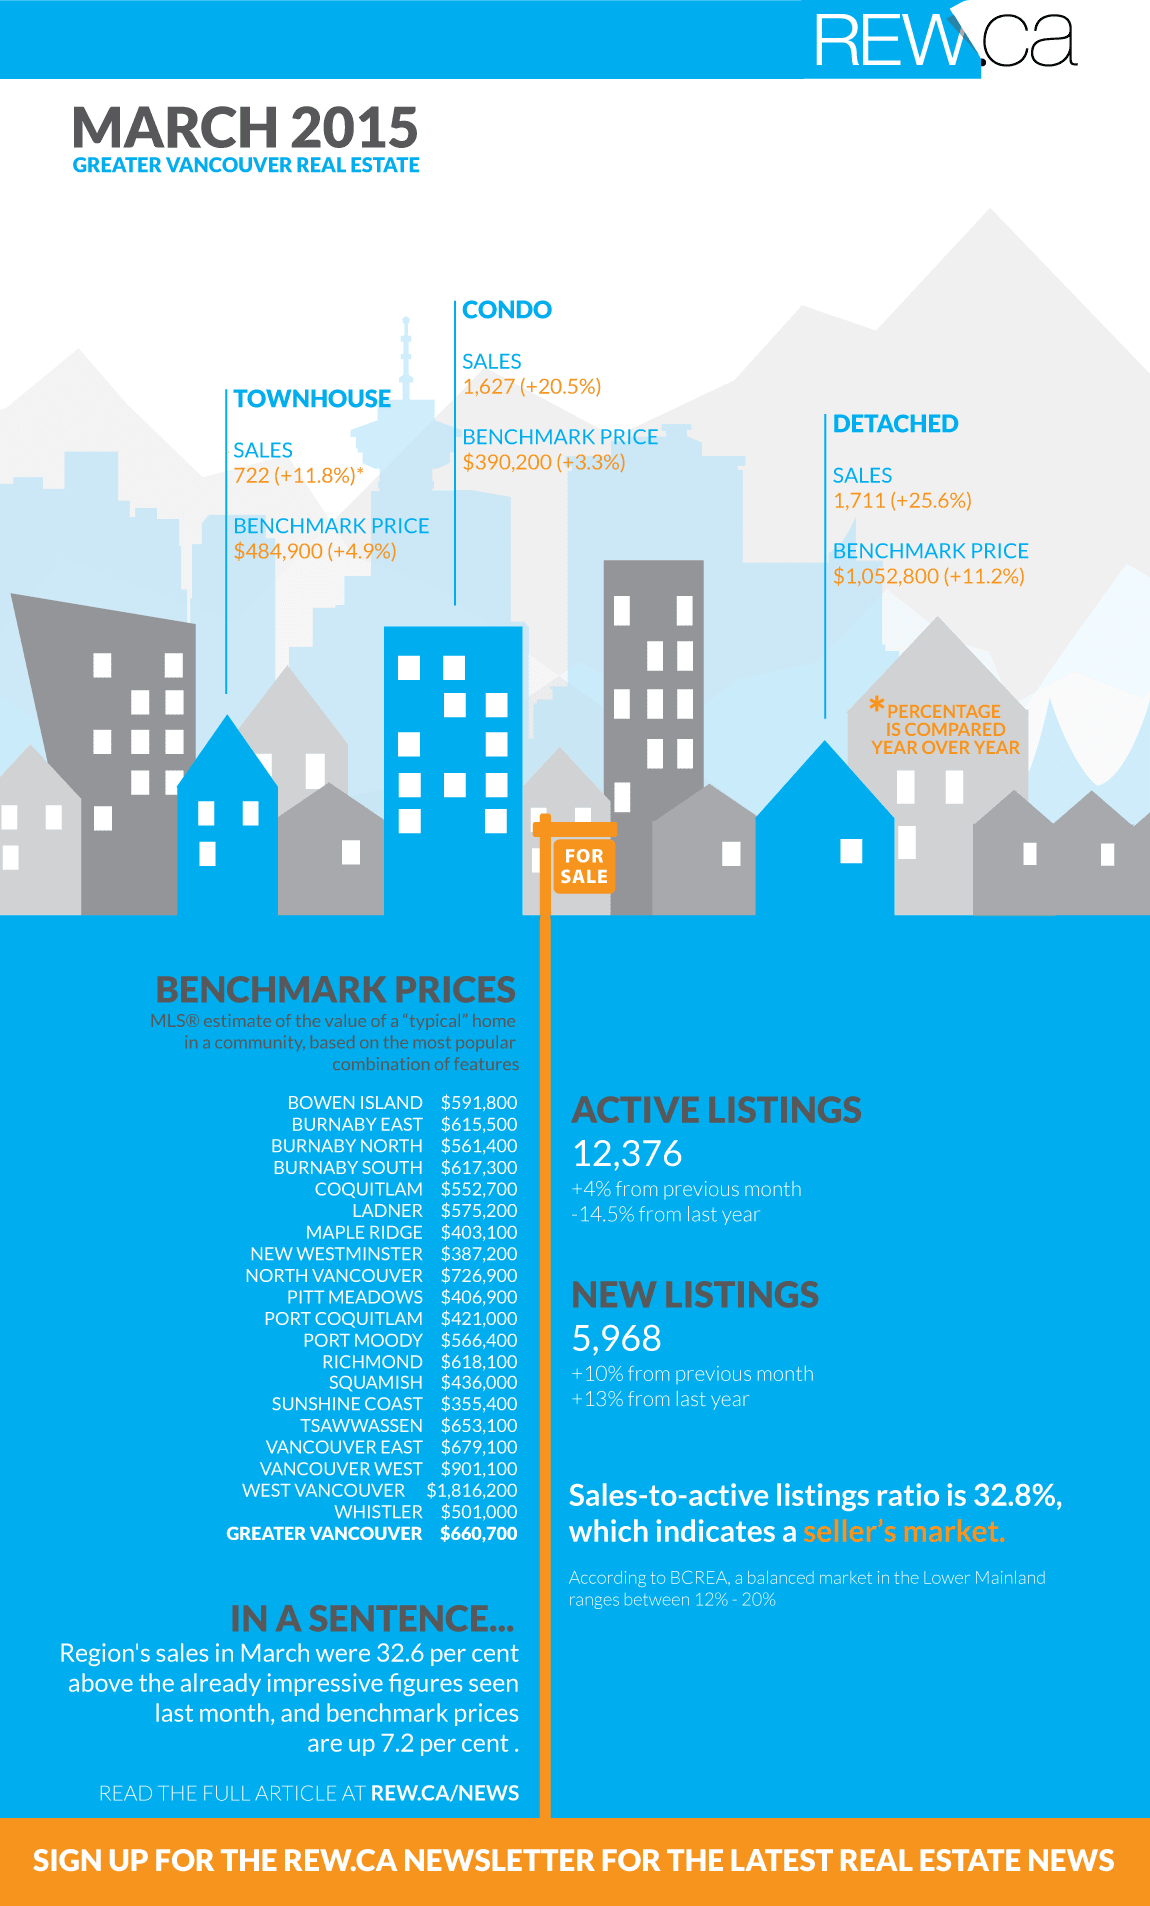
Greater Vancouver has been gripped by spring fever in the real estate market in March, with home sales up nearly 54 per cent year over year, the Real Estate Board of Greater Vancouver announced April. Below is our monthly infographic to help you make sense of the numbers, with the key headline figures and benchmark prices broken down by area. To read the full story and analysis, click here.
March 2015 Greater Vancouver Real Estate Infographic