
March didn't see its usual surge of sales, according to the latest Real Estate Board of Greater Vancouver report on the MLS® home market. While sales increased, they didn't climb at the typical rate for the month. Here's how March's 2,642 home sales compare with sales of the last three years and the 10-year average.
Sales and Listings
For the first time since last July, sales have not been in line with the 10-year average; they’ve dipped 17.2 per cent below. Unusual, in that we’re into what’s usually the busy spring market.
But the sales-to-active-listings ratio remains at 18.2 per cent, about the same as it was last month. That level indicates a healthy demand and a balanced market.
“We continue to see steady and stable market conditions across the Greater Vancouver housing market,” says Ray Harris, REBGV’s new president. “There has been a consistent balance between home seller supply and home buyer demand in our marketplace over the last year.”
Greater Vancouver saw a total of 5,281 new listings hit the market in March, including 2,241 houses, 795 attached properties and 2,245 apartments.
There are currently 14,472 residential properties for sale in the area.
Here’s how the sales and listings compare to last month and last year at this time.
What’s Up, What’s Down – At a Glance Mar / Feb 2014 Mar 2014 / Mar 2013 Overall Sales +4.4% +12.5% - Detached +8.5% +19.6% - Townhome -10.1% -3% - Apartment +7.2% +12.6% New Listings +12.4% +9.1% Current Listings +7.9% -6.4%
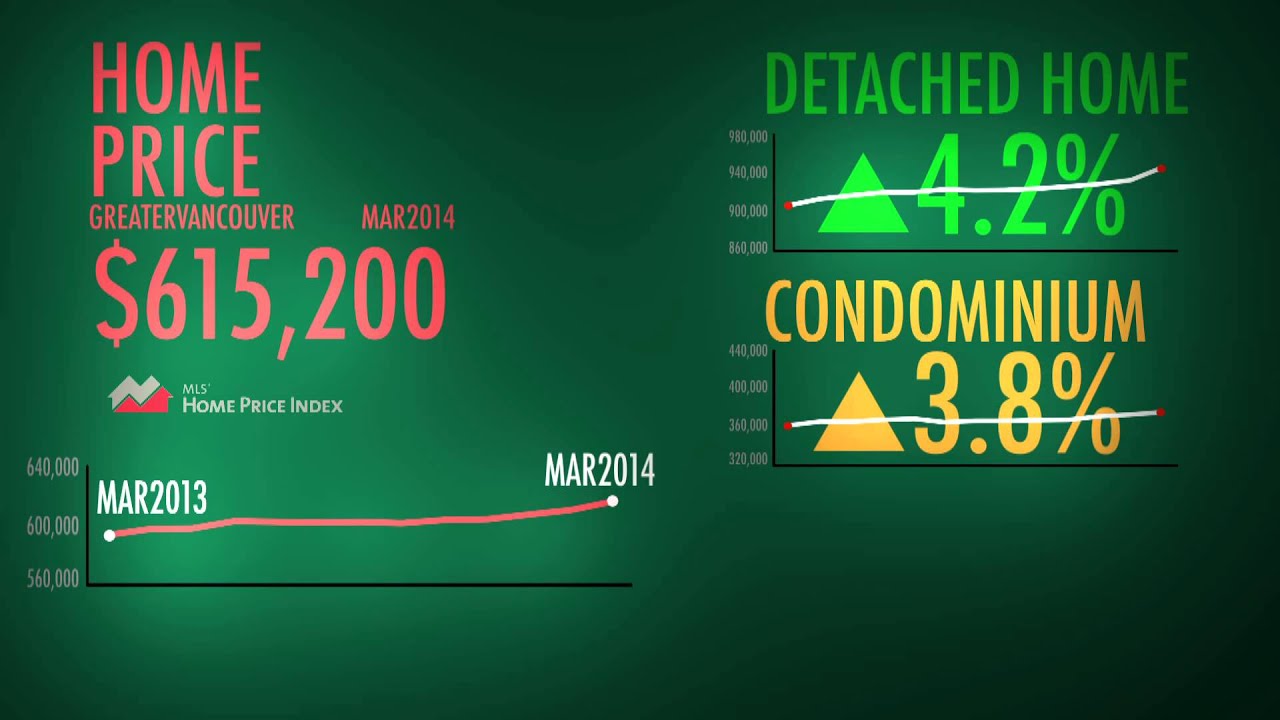
Benchmark Price (MLS® Home Price Index)
The MLS® benchmark prices continue to hold steady, increasing ever-so-slightly every month. The benchmark price is a calculation of the typical home for a particular neighbourhood.
Greater Vancouver MLS® Benchmark Prices % Change Mar 2014 Feb 2014 Mar 2013 Detached $945,400 +1.3% +4.2% Townhome $460,100 +0.4% +1.3% Apartment $375,800 +0.7% +3.8%
Meanwhile, the average price for detached houses—the average of all sales prices during the month—took a steep fall from its all-time high of $1,361,023 in February to $1,209,542 in March. Real estate blogger Larry Yatkowsky points out that there were no sales over $10,000,000 last month. If so, is that a consequence of the change to the investor immigrant program, or is it just a yearly pattern? If you look at the average price graph for detached houses (blue), that high-priced segment has recently tended to peak at or near the start of the year.
While on the subject of average prices in Greater Vancouver, the Royal LePage House Price Survey for Q1 notes that “Detached bungalows saw the largest year-over-year price increase, climbing 4.8 per cent to $1,062,318. The average price for standard two-story homes saw an increase of 2.9 per cent to $1,148,473 while standard condominiums rose 0.3 per cent to $482,800.”
REBGV’s new president, Ray Harris, has some insights on the importance of knowing the right price for the neighbourhood in this month’s video report.
For March statistics broken down by community and housing type, see the detailed REBGV monthly report. The REBGV region covers Sea-to-Sky, Sunshine Coast/Gulf Islands, North Shore, Vancouver, Burnaby, New Westminster, Tri-Cities, Maple Ridge/Pitt Meadows, Richmond and South Delta.