
"This is the most active marketplace we've seen since the spring of 2011," said Ray Harris, president of the Real Estate Board of Greater Vancouver, in response to the May numbers. "Our MLS® statistics tell us that there's more home buyer demand today than at any point over the last three years."
Watch the Real Estate Board of Greater Vancouver video.
Sales and Listings
Home sales continued to rise in May, up 7.7 per cent after a strong April. May is typically the top month for sales — the peak of the spring season.
A total of 3,286 sold on the MLS®. Of these, 1,453 were detached houses, 547 were townhouses or duplexes and 1,286 were apartments.
New listings are floating at 2 per cent below the 10-year average. In May, 5,936, new properties came on the market, down slightly from April; but despite the drop, there are more homes currently for sale than there were in April. Listing numbers have been gradually catching up to almost-normal after lagging for over a year.
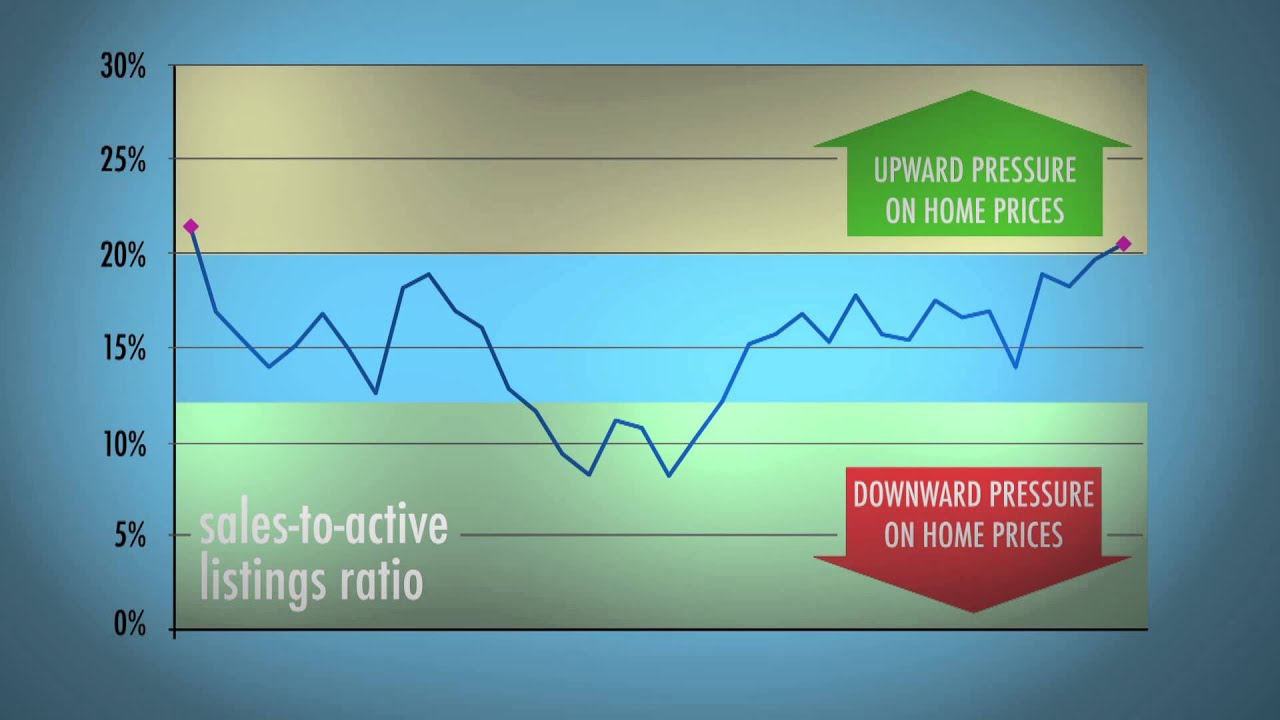
For the moment we’re in a balanced market. At 20.4 per cent, the sales-to-active-listings ratio (the rate at which properties are selling) is the highest it’s been since June 2011. If it remains above 20 per cent for a couple more months, we can consider Greater Vancouver to have entered a seller’s market.
What’s Up, What’s Down – At a Glance May/ Apr 2014 May 2014 / May 2013 Overall Sales +7.7% +14% - Detached +8.8% +19.9% - Townhome +0.9% +2.4% - Apartment +9.7% +13.2% New Listings -0.2% +5% Current Listings +3.6% -6.7%
Benchmark Price (MLS® Home Price Index)
The MLS® benchmark prices continue to hold steady, increasing ever-so-slightly every month. The benchmark price is a calculation of the typical home for a particular neighbourhood.
Greater Vancouver MLS® Benchmark Prices % Change May 2014 Apr 2014 May 2013 Detached $966,500 +1.0% +5.4% Townhome $469,100 +1.0% +3.1% Apartment $375,500 +0.5% +3.2%
With the benchmark price for a single-family house getting perilously close to $1 million, it makes sense to ask, “When will this stop??”
It might not, says Rudy Nielsen, the man behind Landcor Data Corporation in his Q1 Residential Sales Summary:
Real-estate pundits have long predicted that the Lower Mainland’s overheated markets are long overdue for a correction, severe or otherwise. That’s still in the cards but in another opinion, it’s likely not across all product classes.
When walls come down and new spaces open up, especially when these new spaces are seen as open, clean, not crowded and comparatively cheap, it’s no surprise that others flow in. Once here and settling in (and barring a financial or physical catastrophe), that’s the new status quo.
Just an opinion among others, but single family detached (SFD) in Metro Vancouver is now almost immune to downward pressures, especially in certain favoured areas and as these localized SFD prices rise, they pull up SFD prices in other areas.
The words “overvalued” and “unaffordable” come up again and again — no surprise.
The TD Economics Quarterly Regional Housing Report estimates that Vancouver housing is 10 – 15 per cent overvalued, regardless of which metrics are used to measure. The one they prefer is the affordability index: the percent of income an average household would have to devote to mortgage payments if they purchased an average priced home and took out a conventional mortgage. And for Metro Vancouver that percentage was 69.9 in 2013 and forecast to be 71.4 this year. Toronto, the second-least affordable city, was pegged at 42.7 per cent in 2013, with 42.5 predicted for 2014.
TD (and just about everybody else) puts the blame on single-family houses.
The latest housing affordability report from RBC Economics helpfully illustrates this by breaking the Metro Vancouver affordability percentages down by housing type. A condo now demands 39.9% of a buyer’s household income, while detached homes require at least 82.4% of monthly household income. The qualifying annual income for each property is $75,100 and $155,100, respectively.
An affordable home typically requires no more than 32% of household income.
Mind you, these stats depend on reported income, and much of Vancouver’s is not. They also don’t take equity into account. According to real estate marketer Bob Rennie, 69 per cent of all home sales are to people who already own, and local people 55 and older are sitting on $213 billion in residential real estate.
So if you’re asking, “Who are these people who can afford these million dollar houses?” there’s a big part of your answer.
In this month’s REBGV video, President Ray Harris takes a close look at the hot Vancouver East market.
For May statistics broken down by community and housing type, see the detailed REBGV monthly report. The REBGV region covers Sea-to-Sky, Sunshine Coast/Gulf Islands, North Shore, Vancouver, Burnaby, New Westminster, Tri-Cities, Maple Ridge/Pitt Meadows, Richmond and South Delta.
See also:
Fraser Valley Real Estate Market: May 2014
Vancouver vs. Fraser Valley: How the Latest Price-Rise Stats Compare