
Faster, Higher, Stronger? Only in the Olympics.
Slower, Lower, Weaker was the July motto in the Vancouver real estate market. The last couple of years have been a world-beating marathon, but sales were slower, listings were lower, and benchmark prices started to weaken, according to the Real Estate Board of Greater Vancouver's latest statistics.
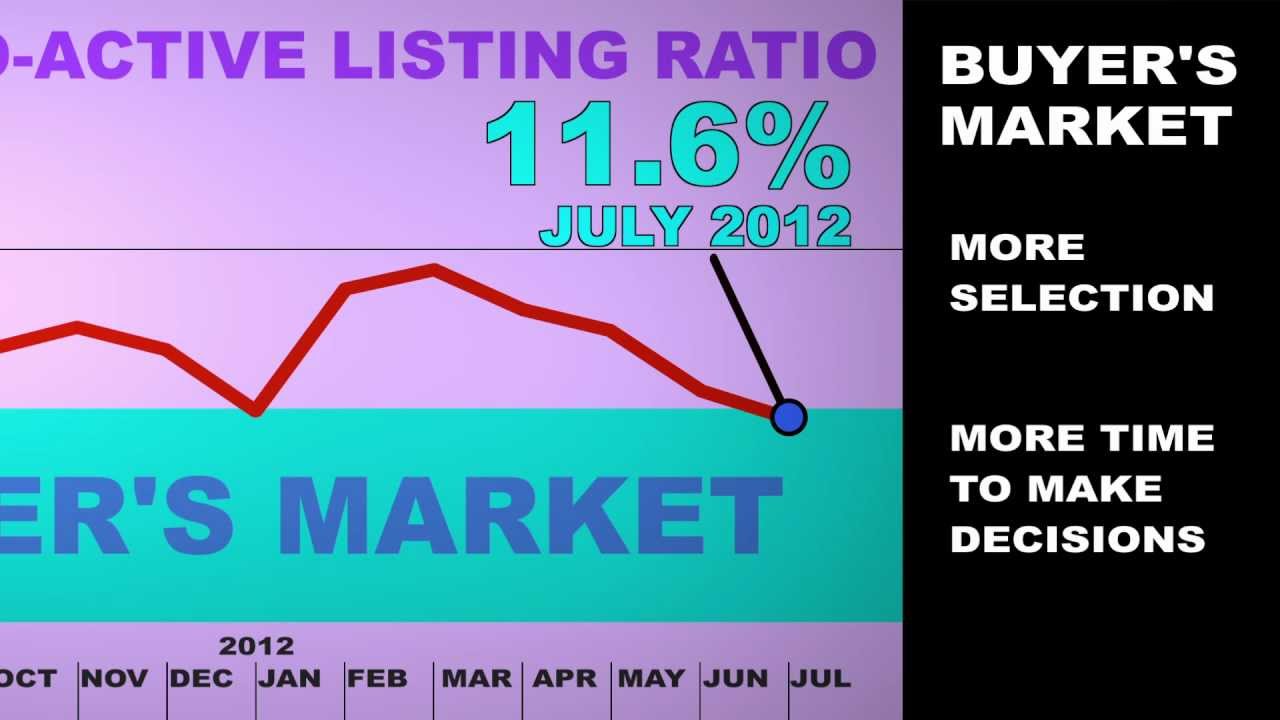
MLS® Sales and Listings
If you can tear yourself away from the synchronized diving and badminton on your TV, walk down any street and see the number of For Sale signs. It will come as no surprise that last month, Greater Vancouver MLS® sales hit the lowest July total since 2000, with 2,098 homes selling out of 18,081 homes for sale. That's a sales-to-active-listings ratio of 11.6 per cent, which REBGV defines as a the upper end of a buyers' market. Price drops are expected when the sales-to-listings ratio falls below 10 per cent.
Sellers are no dummies. A frenzy in May drove new listings more than 15 per cent over the 10-year average for that month. But after that, fewer homeowners listed in June, and even fewer in July. Still, there were still 18.8 per cent more active listings in the REBGV area this July than there were last year at the same time, which reflects the slowdown in sales.
So for sales and listings, this year we're seeing more of a summer lull than usual.
What's Up, What's Down - At a Glance July 2012/June2012 July 2012/July 2011 Overall Sales -11.2% -18.4% - Detached -14.3% -28.4% - Townhome -7.5% -11.1 % - Apartment -9.6% -10.9% New Listings -14.5% -5.8% Current Listings -2.2% +18.8%
Benchmark Price (MLS Home Price Index)
The MLS® Home Price Index is definitely starting to reflect the changes in sales and listings. After a pretty smooth run-up starting in March of 2009, it seems to have hit a peak in May for detached houses and apartments. Townhouse prices are on their own trajectory, and actually went up ever so slighly over June.
Greater Vancouver Benchmark Prices % Change July 2012 June 2012 July 2011 Detached $950,200 -1.2% +1.4% Townhome $468,700 +0.1% -0.5% Apartment $374,300 -0.5% 0.0%
It's summer with a vengeance in the Greater Vancouver real estate market.
You can read the full stats package here.