
If you want to buy a home in Greater Vancouver, you've got lots to choose from. The Real Estate Board of Greater Vancouver reports that 15,236 MLS® properties were on the market in March. That's 8.4 per cent more listings than last month and 16 per cent more than the same time last year. Listings have been on the increase since December in the Greater Vancouver real estate market.
Meanwhile, 2874 properties sold. That's up 12.9 per cent from February, but down almost 30 per cent from last March. In fact this March saw sales 16.8 per cent lower than the 10-year average.
However, prices held steady, increasing slightly over February despite lower-than-average sales. So, no, the sky is not falling. Things are just balanced, but it feels weird because that's something we haven't been used to over the last three years.
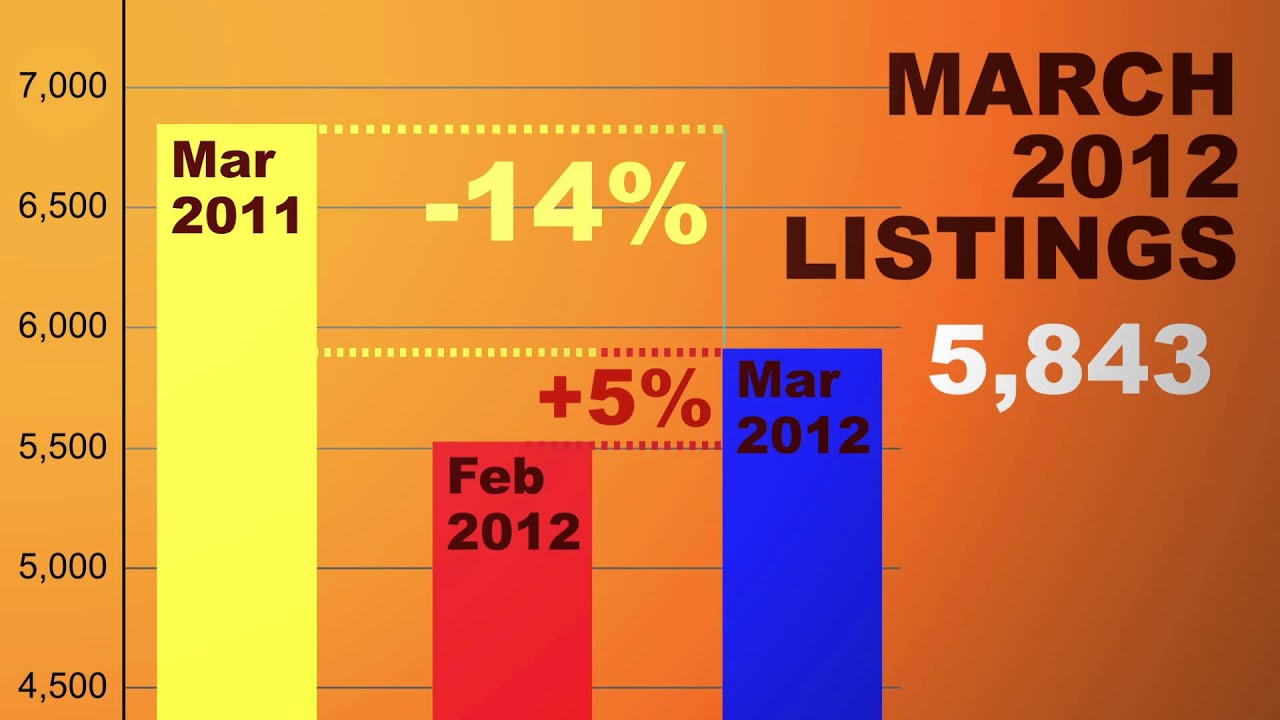
What's Up, What's Down - At a Glance M/M Mar 2012/Feb 2012 Y/Y Mar 2012/Mar2011 Overall Sales +12.9% -29.6% - Detached +7.5% -34.1% - Townhome +17.9% -24.6% - Apartment +16.8% -26.6% New Listings +5.2% -14% Current Listings +8.4% +16%
Benchmark Price (MLS Home Price Index)
Greater Vancouver Benchmark prices for all types of resale home again held pretty steady from February, with an average 1.1 per cent increase across the region. That small increase puts the overall benchmark price for a home in Greater Vancouver at $679,000, up 22 per cent from five years ago.
So far this year the benchmark price has risen by 2.1 per cent. The biggest benchmark price growth since January has been in townhomes in Squamish (9.8 per cent) and Whistler (14.3 per cent).
(Note that the REBGV's figures don't cover Surrey, Langley, Abbotsford and Chilliwack.)
Within the area covered by REBGV, you'll find a huge range in benchmark prices. The lowest prices on the mainland are in Maple Ridge, where the benchmark price is $468,800 for a house, $274,000 for a townhouse and $185,600 for a condo. The highest benchmark prices -- to no one's surprise -- are in Vancouver West, where the typical detached house is up to $2,250,100, townhouse, $704,900 and condo, $472,400. West Vancouver actually beats Vancouver West in the last category. A typical West Van apartment will set you back $616,800.
Greater Vancouver Benchmark Prices % Change Mar 2012 Feb 2012 Mar 2011 Detached $1,056,400 +1.1% +9.2% Townhouse $480,900 +1.5% +0.9% Apartment $375,100 +0.8% +2.2%
You can read the full stats package here.
You can watch the video below:
If you want to buy a home in Greater Vancouver, you've got lots to choose from. The Real Estate Board of Greater Vancouver reports that 15,236 MLS® properties were on the market in March. That's 8.4 per cent more listings than last month and 16 per cent more than the same time last year. Listings have been on the increase since December in the Greater Vancouver real estate market.
Meanwhile, 2874 properties sold. That's up 12.9 per cent from February, but down almost 30 per cent from last March. In fact this March saw sales 16.8 per cent lower than the 10-year average.
However, prices held steady, increasing slightly over February despite lower-than-average sales. So, no, the sky is not falling. Things are just balanced, but it feels weird because that's something we haven't been used to over the last three years.