While not actually using the words "buyers' market," the Real Estate Board of Greater Vancouver indicated that MLS® real estate activity in January 2012 favoured buyers, with greater price stability and more inventory on the market for longer.
In fact, new listings were up by 253.3 per cent over the previous month, contributing to the highest new listing count for January since 1995.
What's Up, What's Down - At a Glance Jan 2012/Dec 2011 Jan 2012/Jan 2011 Overall Sales -4.9% -13,3% - Detached +4.4% -16.9% - Attached +2.4% -7.9% - Apartment -15.1% -16.6% New Listings +253.3% +19.9% Current Listings +12.5% +20.2%
The January statistics package introduced the new MLS® Home Price Index, which replaces the old HPI used (and developed) by the Greater Vancouver and Fraser Valley Boards. The new HPI sets its benchmark as 100 for January 2005. Benchmark prices from the old HPI cannot be compared to benchmark prices from this new one.
Here's the new HPI graph going back to January 2007:

REBGV Market Stats for January
Benchmark prices are higher than last January across the board except for a 3.2 per cent slump in Pitt Meadows and a 0.9 per cent drop in Port Moody. However, in July 2011 prices declined everywhere except North Vancouver and Vancouver West. Prices across Greater Vancouver have been gently recovering ever since.
The overall benchmark price for a home in Greater Vancouver is $660,600, up 5.7 per cent from January 2011 and up 22.1 per cent from five years ago.
Greater Vancouver Benchmark Prices % Change Jan 2012 Dec 2011 Jan 2011 Detached $1,034,700 -0.1% +11.3% Townhouse $468,000 -0.7% -0.5% Apartment $371,500 +0.3% +2.4%
You can read the full stats package here.
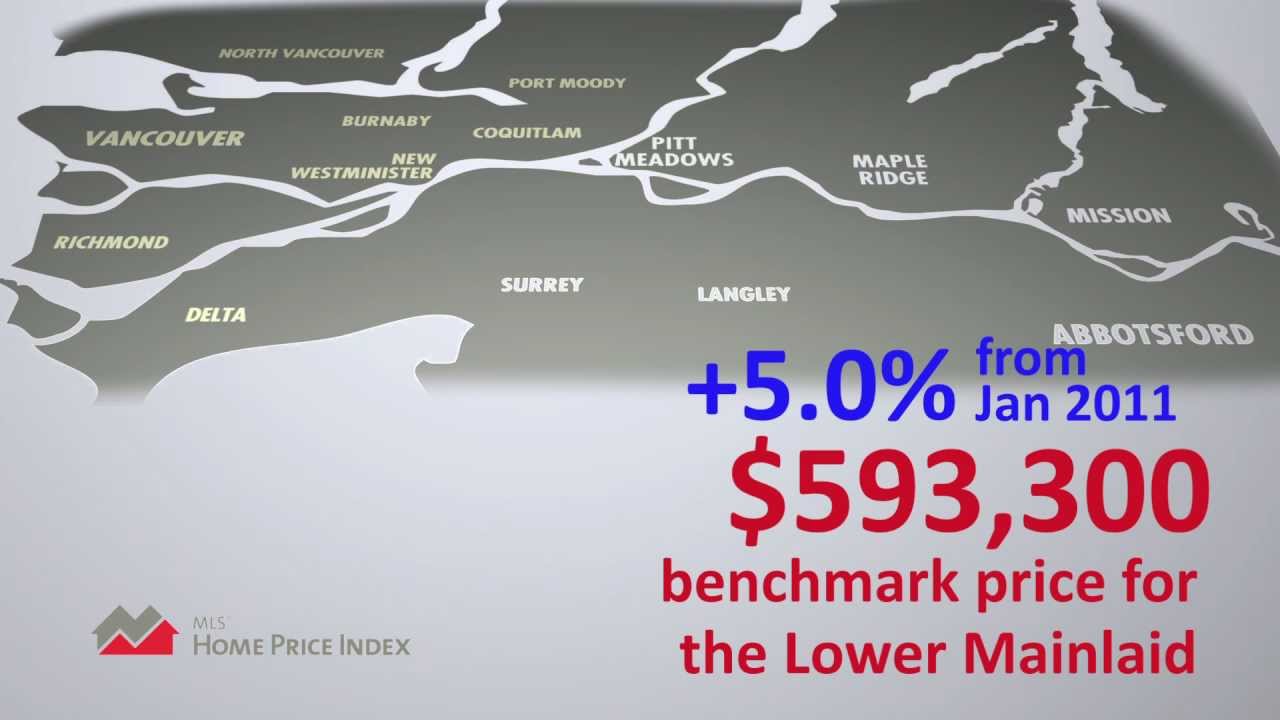
You can watch the video below.