
You'd be hard pressed to pick any one of the last 10 years in the Greater Vancouver real estate market and call it average. We've had dizzying price hikes, a breathtaking sales and price drop, an even more remarkable recovery, rampant speculation, topped (or bottomed) off with a really lousy 2012 for sales, even though prices didn't reflect it.
So what do we get excited about? We compare this year's MLS® sales to last year's (see: "really lousy," above). A 63.8 per cent increase! Wow! The market is booming! It's surging!
No, it's not. If you look past the headlines and Tweets, you get a different picture. What the Greater Vancouver real estate market is actually doing right now is hovering around 10-year statistical averages. It's recovering well from 2012 and acting stable. And that's good!
"Home sale and listing activity this September were in line with the 10-year average for the month," says Sandra Wyant, president of the Real Estate Board of Greater Vancouver. REBGV stats show that the sales-to-listings ratio has been in balanced territory since March, and prices have barely budged all year.
Not bombastic, perhaps, but a nice, sane atmosphere for buyers and sellers.

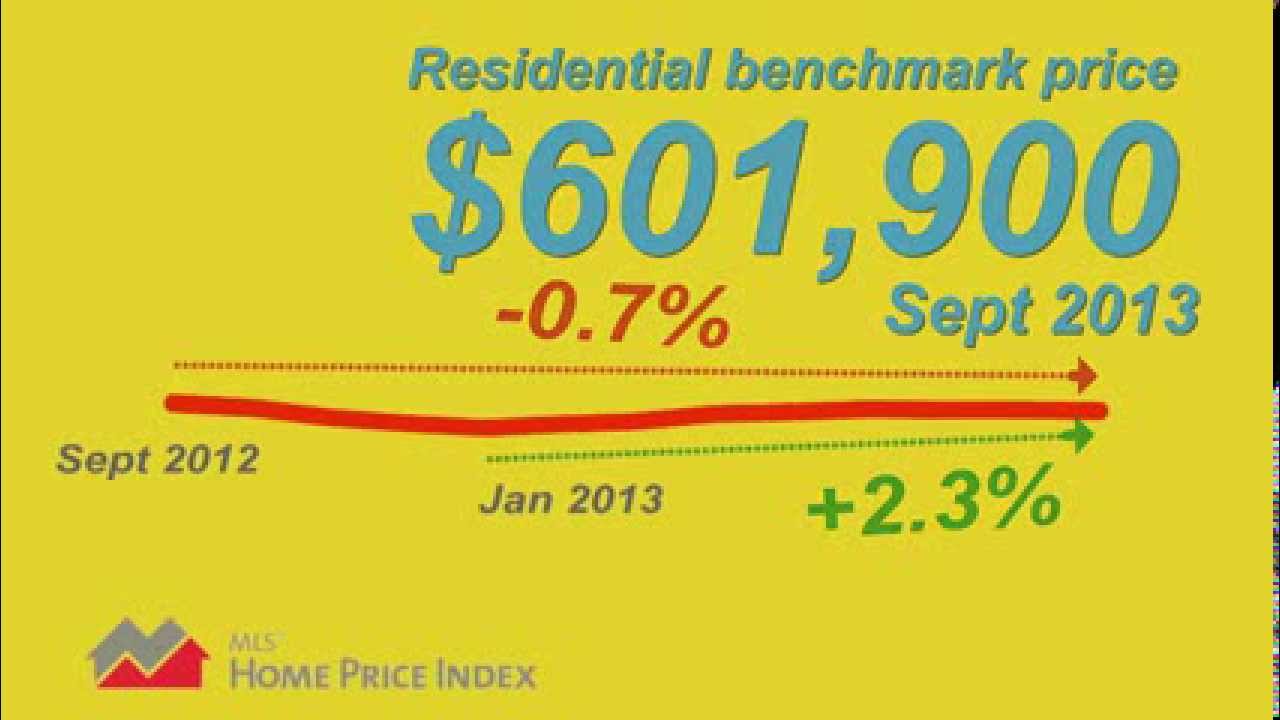
Greater Vancouver real estate sales september 2013 with 10-year average
Sales and Listings
A total of 2,483 homes sold on the MLS® in September. That was down 1.2 per cent from 2,514 in August and down 15.8 per cent from July's unexpected peak of 2,946. September often sees an extra flurry of sales before the winter lull, so last month was slightly unusual in that respect.
But as you can see from the table, sales of all kinds far outshone those of 2012, when prices were widely expected to plummet, and buyers and sellers stayed out of the market. September 2012 was tied with September 2008 (beginning of the recession) for lowest sales in the last 10 years, and Sandra Wyant notes that those were among the lowest sales in thirty years. So all those big year-over-year gains indicate a good recovery, but not much else.
What's Up, What's Down - At a Glance Sept 2013 / Aug 2013 Sept 2013 / Sept 2012 Overall Sales -1.2% +63.8% - Detached -3.2% +72.2% - Townhome -0.5% +79.7% - Apartment -0.0% +50.6% New Listings +20.2% -5.5% Current Listings +0.5% -12.2%
More homes were listed on the MLS® in September as sellers anticipated a typical fall pick up in sales. New listings were up by 20.2 per cent over August. This is no cause for alarm. It's right in line with the month-over-month increases in 2011 (21.2 per cent) and 2010 (20.8 per cent). And it's less than the difference between August and September new listings last year (31.6 per cent).
Despite the increase in new listings, total active listings stayed about the same as August. This can't be explained by an increase in salessales were actually down from August. Therefore, a number of listings must have expired or been taken off the market. The takeaway is that a sale is not a slam-dunk in this market. Sellers have to be realistic about their prices. Buyers are not feeling forced into anything, and they have time to be choosy.
The sales-to-active-listings ratio dropped slightly to 15.4 per cent. That means the market is still considered to be balanced, neither a sellers market nor a buyer's market.

Greater Vancouver real estate market sales to listings ratio
Benchmark Price (MLS® Home Price Index)
There's not much to talk about when it comes to home prices. In all but the smallest markets Bowen Island, Squamish, Sunshine Coast and Whistlerany movement in the benchmark price was within 1 per cent of zero from August to September.
For benchmark price changes by city and housing type, see the REBGV's detailed stats package.
Greater Vancouver MLS® Benchmark Prices % Change Sept 2013 Aug 2013 Sept 2012 Detached $922,600 -0.1% -1.4% Townhome $458,300 +0.3% -0.1% Apartment $366,600 +0.1% -0.5%
If you're casting about for some excitement in home prices, look south. The announcement of a bridge to replace the Massey Tunnel could cause some price movement in Ladner and Tsawwassen. Both currently offer some of the best housing values in Greater Vancouver, along with a small-town atmosphere. Benchmark for a single-family home in Ladner is $622,000 and in Tsawwassen, $714,300.
The tunnel has often been credited withor blamed forkeeping land values in check. In a few years that bottleneck will be gone.
For a video wrap-up of the September Greater Vancouver real estate market, here's Ray Harris, president-elect of the REBGV.
See detailed Real Estate Board of Greater Vancouver stats for September See also:
Fraser Valley Real Estate Market: September 2013