
The Real Estate Board of Greater Vancouver figures for April show healthy spring sales that are putting us on the verge of a seller's market. Prices remain calm, but in general house and townhouse prices continue to edge up month by month for, while condo prices remain static.
Watch the Real Estate Board of Greater Vancouver video.
Sales and Listings
MLS® home sales across Greater Vancouver picked up in April, with 3,050 properties changing hands. Sales nearly caught up with the 10-year average again, ending up within 5.2 per cent of it, after dropping 17.2 per cent under in March.
There were 1,332 detached house sales, 542 townhouse/duplex sales and 1,172 apartment sales in April. Compared to March, those were hefty increases of 19.4 per cent for houses and 29.4 per cent for attached properties, while condo sales rose by 6 per cent.
New listings were up over the previous month in all categories, but they weren't up enough to offset April's robust sales. A total of 5,950 new listings hit the market in April, including 2,564 houses, 931 attached properties and 2,363 apartments.
What's Up, What's Down - At a Glance Apr / Mar 2014 Apr 2014 / Apr 2013 Overall Sales +15.5% +16.1% - Detached +19.4% +25.6% - Townhome +29.4% +6.1% - Apartment +6.0% +11.4% New Listings +12.7% +1.3% Current Listings +7.2% -7.3%
There are currently 15,515 residential properties for sale in the area. Divide that by the 3,050 sales and you get the highest sales-to-active-listings ratio since June 2011. Here's a look at how the sales-to-listings ratio has fared over the last two years compared to the REBGV's definitions of buyer's, seller's and balanced markets.

Real Estate Board of Greater Vancouver sales to listings April 2012-2014
At 19.7 per cent, the current sales-to-listings ratio is pushing a seller's market. Quoted in Business in Vancouver, REBGV president Ray Harris says, "We're not in a sellers' market. For that to happen we would have a higher price-to-active-listings ratio for a sustained amount of time."
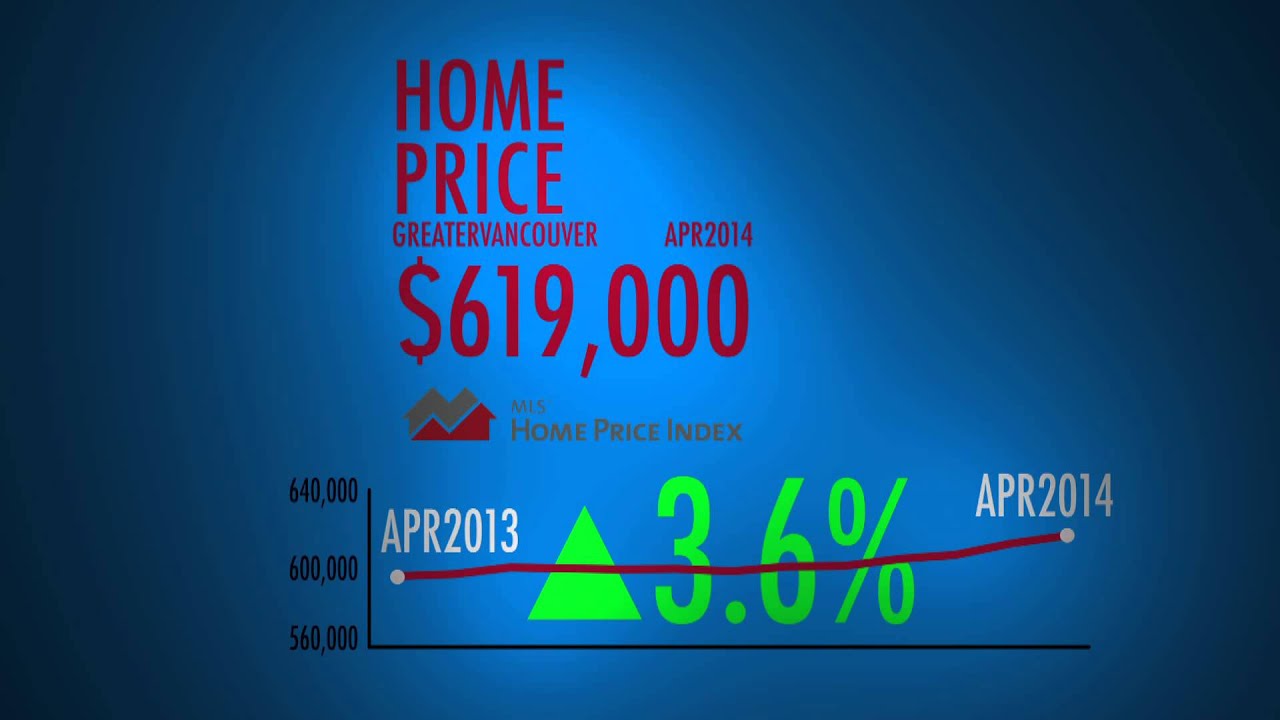
Benchmark Price (MLS® Home Price Index)
The MLS® benchmark prices continue to hold steady, increasing ever-so-slightly every month. The benchmark price is a calculation of the typical home for a particular neighbourhood.
Greater Vancouver MLS® Benchmark Prices % Change Apr 2014 Mar 2014 Apr 2013 Detached $956,700 +1.2% +4.7% Townhome $464,400 +0.9% +2% Apartment $375,500 -0.1% +2.6%
According to a new BMO poll, home owners in Vancouver believe their property values have increased by an average of $269,000 since they bought them.
Vancouver owners believe they could sell their properties at an average price of $698,000 for all home types. (The average benchmark price for all housing types in Greater Vancouver is $619,000 and in the Lower Mainland is $555,100.) Over 25 per cent of owners believe the value of their home has more than doubled since they bought them.
If they bought their home ten years ago or more, they're probably right. Greater Vancouver home prices started their dizzying climb in 2002. The benchmark price for detached houses has doubled since it hit $469,080 in March of 2004. Condos were about half of today's benchmark price in January 2003 at $187,570. And attached properties cost $231,190 in January of 2001, about half of today's benchmark price.
Urban Futures has done a Lower Mainland map showing changes in median prices from 2009 2013. The biggest increases during that time were not where you might expect. They were in Anmore and the University Endowment Lands, with UEL median prices increasing a whopping 706%. Click here for the map.
In his April market video, REBGV president Ray Harris looks at price appreciation in the last four years and sees a widening gap between houses and attached or condo properties.
For March statistics broken down by community and housing type, see the detailed REBGV monthly report. The REBGV region covers Sea-to-Sky, Sunshine Coast/Gulf Islands, North Shore, Vancouver, Burnaby, New Westminster, Tri-Cities, Maple Ridge/Pitt Meadows, Richmond and South Delta.